
Finding Chart
A chart of the sky around a plate solved image, as a new image
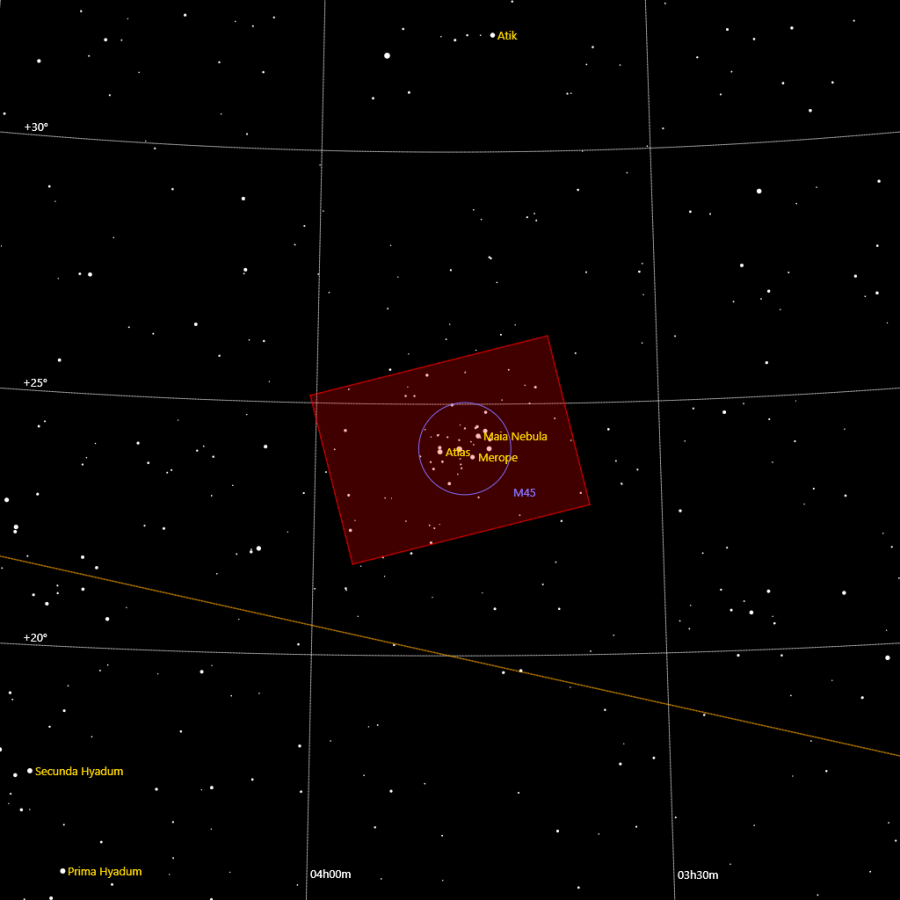
Finding Chart draws a chart of the sky around a plate solved image, as a new image: the stars of the catalog with their magnitudes, the outline of our image's field, the grid of the coordinates, the ecliptic, the galactic equator, the constellations and the names of the bright stars and of the Messier, NGC and IC objects. It answers where our image lies, and what is around it.
1Introduction
A finding chart puts a picture back in its place. The chart is centered on the image, north up and east to the left, in a gnomonic projection, as an ordinary star atlas. The field of the image is drawn on it as a filled outline, bordered, so that we see how much of the sky it covers and which bright stars and objects lie just outside. The scale can be chosen, or left automatic, in which case the diagonal of the image takes a third of the chart.
The stars come from the catalog service of the program, moved to the date of the image, and drawn as disks whose radius follows the magnitude. The faintest magnitude drawn follows the chart's area unless we set it. The grid is the equatorial one, with right ascension in hours and minutes and declination in degrees and minutes, labeled at the left and at the bottom. The ecliptic and the galactic equator are drawn for J2000, and the names of the bright stars and the Messier objects, and optionally the NGC and IC objects, are placed so that labels do not overlap. A nebula is marked by its outline where the sky data has one, and every other object by a circle of its size where it is known. The constellations are drawn under the stars: the IAU's borders, the figures of the Modern IAU sky culture and the constellations' names, each at the center of its area when that is on the chart, else in the middle of its part of the chart.
The names, the figures and the borders come from the sky data that ships with the program: plain text files in the folder data/sky, next to the program. The deep-sky objects are OpenNGC's and the constellation figures Stellarium's, both under the Creative Commons Attribution-ShareAlike 4.0 license, and the star names are the IAU's (see Credits and Licenses).
The image is only read, and it must have an astrometric solution: the program offers to solve one first. Finding Chart follows PixInsight's FindingChart by its parameters, and a PixInsight icon of that process opens here.
2Quick Start
- Open the image and choose . An image that is not solved is offered to be solved first.
- Leave the settings as they are for a first chart. To zoom out, turn off Automatic resolution and raise Resolution.
- Click Apply. The chart arrives in a new tab, named after the image with
_fcat the end.
3Interface & Parameters
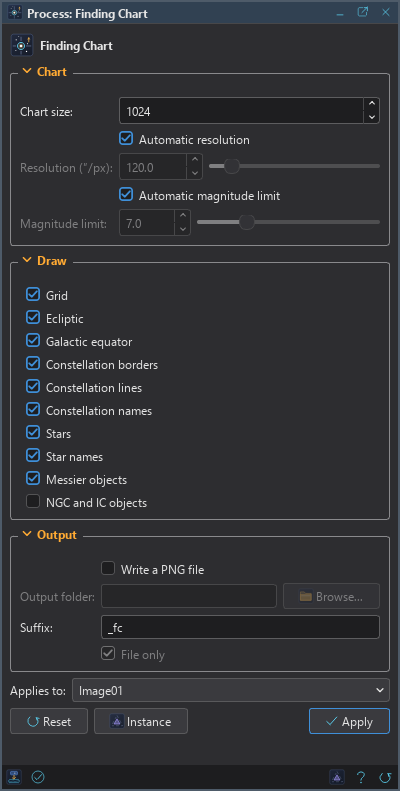
The panel has three sections, Chart, Draw and Output, each of which folds away with the arrow beside its title, then the image the process applies to, the buttons and the system bar along the bottom. The colors of the chart are parameters of the process, kept in saved processes and icons, but the panel does not show them.
3.1Chart
Chart size: The chart's width and height, in pixels, from 512 to 65536. 1024 by default.
Automatic resolution: Chooses the chart's scale so that the image's diagonal is a third of the chart, at most 120 degrees across. On by default.
Resolution (″/px): The chart's scale, in arcseconds per pixel, from 1 to 1200. 120 by default. Used when the automatic resolution is off.
Automatic magnitude limit: Draws stars down to a magnitude that suits the chart's field: 14 less 2.5 times the logarithm of the chart's area in square degrees, between 4 and 16. On by default.
Magnitude limit: The faintest stars drawn, in Gaia G, from 4 to 16. 7 by default. Used when the automatic limit is off.
3.2Draw
Grid: The equatorial grid, five to eight lines across, with its coordinates. On by default.
Ecliptic: The ecliptic, labeled. On by default.
Galactic equator: The galactic equator, labeled. On by default.
Constellation borders: The constellations' borders, as the IAU set them. On by default.
Constellation lines: The constellations' figures, from the Modern IAU sky culture. On by default.
Constellation names: The constellations' Latin names. They give way to every other label. On by default.
Stars: The catalog's stars, sized by their magnitudes. On by default.
Star names: The proper names of the bright stars. On by default.
Messier objects: The Messier objects, marked by their sizes. On by default.
NGC and IC objects: The NGC and IC objects, marked by their sizes where they are known. Off by default.
Nebula outlines: Mark a nebula by its outline where the sky data has one (OpenNGC's outlines of some 380 nebulae), else by a circle of its size. On by default. This setting is DSPX's own: a PixInsight icon does not carry it.
3.3Output
Write a PNG file: Also writes the chart as a PNG file in the output folder. Off by default.
Output folder: Where the PNG file is written. The folder is asked for before the run, when it is needed.
Suffix: Put after the image's name for the chart's name and its file's. _fc by
default.
File only: When the chart is written as a file, does not open it as an image too. On by default.
3.4Apply and Instance
Applies to: The image whose chart is made, chosen in a list of the open images. It shows the image in front, and follows it as we bring other images to the front. Picking another image in the list makes the panel work on that one without bringing it to the front, and Follow Active, the small button that appears beside the list, makes the panel follow the image in front again.
Apply: Makes the chart of the image named in Applies to, as a new 32-bit color image without an astrometric solution of its own. The image is only read: no history step, and its own mask plays no part.
Instance: Shows the process as the panel has it now, as text: a DSPX process
(.dsproc) or a PixInsight process icon (.xpsm), chosen under Format. Copy puts the text
on the clipboard; Save... saves it as a file and puts it on the Process Shelf.
Reset: Puts every setting back to its default.
The system bar along the bottom has the same commands as small icons: at the left, drag to apply and Apply; at the right, Instance, Help (this page) and Reset.
4What the Chart Shows
- The field of the image: its outline, which is its border through the solution, filled and bordered.
- The stars: the catalog's, with the bright stars that Gaia lacks added, moved to the image's date, as disks of a radius that follows the magnitude.
- The lines: the equatorial grid, the ecliptic and the galactic equator.
- The constellations: the IAU's borders, the figures and the names.
- The names: the proper names of the bright stars, the Messier objects, and with the setting the NGC and IC objects, each marked by its outline where the sky data has one, else by a circle of its size where it is known. The 110 Messier numbers (M 102 is M 101, as OpenNGC has it) and some 13000 NGC and IC objects are known.
5Usage Tips and Tricks
Zoom out to see the neighborhood. Turn off the automatic resolution and raise the resolution to see the constellation around a small field.
NGC and IC for a rich field. The Messier objects are enough for most charts. For a field of galaxies, turn on the NGC and IC objects and lower the magnitude limit with it.
A chart for the caption. Write the chart as a PNG file with File only on, to have it ready to put beside the image in a post or a gallery.
6Related Tools
Plate Solve: solves an image that has no astrometric solution, which the chart needs.
Survey Overlay: the survey image of the sky behind our image, matched to it pixel for pixel.
Catalog Star Color: another use of the catalog around a solved image.