
Curves
Curves through points, for channels, lightness, color, hue and saturation
Curves changes the brightness or the color of an image along curves we draw through points: for the red, green and blue channels, for the three together, for alpha, for the CIE lightness L*, the color components a* and b*, the chroma c*, and for the hue and the saturation. It is the tool for contrast, for the final tone of an image, and for precise color adjustments.
1Introduction
A curve maps each input value, on the horizontal axis, to an output value, on the vertical one. The straight diagonal changes nothing; a curve above it brightens, below it darkens, and an S shape adds contrast in the middle at the expense of the ends. Curves offers eleven of them, each with its own points and its own interpolation, applied one after the other:
- R, G and B, each channel by itself, then RGB/K, the three together (or a gray image), then A, the alpha channel.
- L*, the CIE lightness, which changes the brightness without changing the color; a* and b*, the green to red and blue to yellow components; c*, the chroma, how far a color is from gray.
- H, the hue: a curve that moves hues to others; S, the saturation, with the lightness kept.
Curves is our own engine, written from PixInsight's documentation of CurvesTransformation, with its parameters: a PixInsight icon of CurvesTransformation opens here, and the panel saves one that PixInsight opens.
2Quick Start
- Open the image, usually a stretched one, and choose . With the live preview (the eye) on, the result shows on the image as we draw.
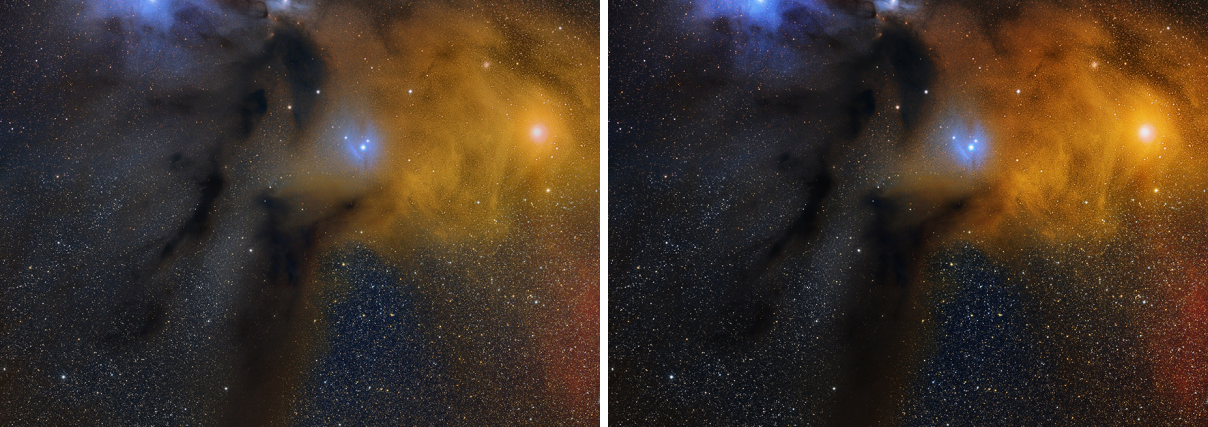
- With RGB/K chosen, click on the curve near the shadows and drag the new point down a little; click near the highlights and drag up. That is an S curve.
- For color, choose S and raise the curve for more saturation, or L* for contrast without a change of color.
- Click Apply.
3Interface & Parameters
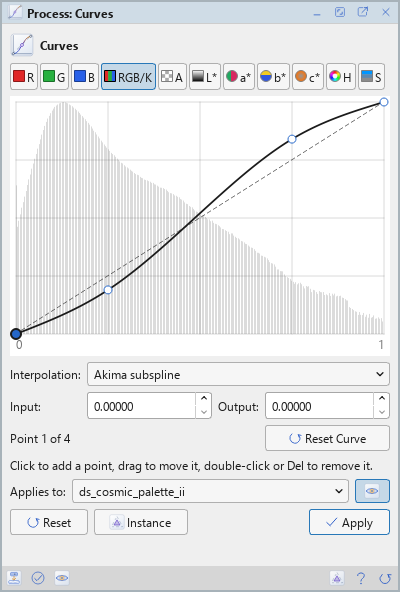
The panel is a curve editor: the eleven curve buttons, the plot with the curve and the image's histogram behind it, the interpolation, the point chosen and Reset Curve. Under it are the image the process applies to with the live preview's eye, the buttons and the system bar along the bottom.
3.1The Curves
Each button chooses the curve the editor shows; the other curves we changed are drawn faint behind it. Each of them is a setting:
Red: The red channel's curve (R).
Green: The green channel's curve (G).
Blue: The blue channel's curve (B).
RGB/K: The curve of the three channels together, or of a gray image.
Alpha: The alpha channel's curve (A), for an image that has one.
CIE L*: The lightness curve (L*): brightness and contrast with the colors kept.
CIE a*: The a* curve (a*), from green to red; 0.5 is neutral.
CIE b*: The b* curve (b*), from blue to yellow; 0.5 is neutral.
CIE c*: The chroma curve (c*): above the diagonal, colors move away from gray.
Hue: The hue curve (H): each input hue becomes the output hue. Under it, a band of the hues shows which is which.
Saturation: The saturation curve (S): HSV saturation changed with the CIE lightness kept, so more saturation does not brighten the image.
Behind R, G, B and RGB/K the plot shows the image's histogram. On the plot, a click adds a point where it is, a point is dragged between its neighbors, and a double click or Delete removes it; the first and the last points cannot be removed. Under the plot, Input and Output are the values of the point chosen, which can be typed, and the line under them says which point it is. Reset Curve makes the curve shown straight again.
Interpolation: How the curve shown goes through its points:
- Akima subspline: the default. Smooth, and it does not overshoot: between two points the curve stays within their values. With the PixInsight compatibility mode on (), it is PixInsight's Akima, which can overshoot between points far apart in value. A curve of fewer than five points is drawn as a cubic spline.
- Cubic spline: a natural cubic spline, smoother, and able to overshoot between points that are close.
- Linear: straight lines from point to point.
3.2Apply, Preview and Instance
Live preview (the eye): At the end of the Applies to row; Preview in the system bar is the same switch. On by default. The image shows Curves applied to the part in view, as the curves change, with the banner "PREVIEW only, nothing applied"; the image itself does not change until Apply. Before, in the banner, or the backslash key held, shows the image as it is. At 1:1 the preview is exactly what Apply gives there; at a reduced zoom it is computed on the reduced view and is very close. With many curves on a large view, the preview updates when we release the mouse.
Applies to: The image Curves works on, chosen in a list of the open images. It shows the image in front, and follows it as we bring other images to the front. Picking another image in the list makes the panel work on that one, its live preview included, without bringing it to the front; the pick stays while we work on other images, and Follow Active, the small button that appears beside the list, makes the panel follow the image in front again. An image that a tool or a run is working on is listed, but cannot be picked.
Apply: Applies the curves to the image named in Applies to, in one history step that Undo takes back, through the image's mask if it has one. A gray image takes RGB/K and alpha alone. The size, the sample format and the metadata stay as they are.
Instance: Shows the process as the panel has it now, as text: the settings as a DSPX
process (.dsproc) or as a PixInsight process icon (.xpsm) of CurvesTransformation, chosen under
Format. Copy puts the text on the clipboard; Save... saves it as a file and puts it on the Process
Shelf.
Reset: Makes every curve straight again.
The system bar along the bottom of the panel has the same commands as small icons: at the left, drag to apply and Apply; at the right, Instance, Help (this page) and Reset. Drag to apply, the first icon, carries the process with its settings: dropped on an image's window, it applies them to that image, whatever image the panel works on; dropped on the Process Shelf, it is kept there as a row of its own. With , the bar alone has them.
4The Order of the Curves
The curves are applied in a fixed order: R, G and B, then RGB/K, then alpha; then L*, a* and b* together in CIE L*a*b*; then c*; then the hue; then the saturation. A curve left straight is skipped. Each curve is computed as a table of 65536 values, which follows the exact curve to within 1/65535. The color components are computed in the sRGB working space with a D50 white, PixInsight's default.
5Usage Tips and Tricks
Contrast without color shifts. An S curve on RGB/K changes the saturation of the midtones a little; the same curve on L* changes the brightness alone.
Small moves. On a stretched image, points moved by a few hundredths make a visible difference; a strong curve quickly brings out noise and clips detail.
Fix a cast with one channel. A slight bend of one channel's curve, where its histogram is offset from the others, warms or cools the image.
Saturation through a mask. With a mask of the nebula attached, the S curve raises the color of the nebula and leaves the background's noise as gray as it was.
GPU. On a large image (a quarter of a megapixel or more), the red, green, blue, RGB/K and alpha curves run on the graphics card in DSPX mode, and the result agrees with the processor's to a few millionths (one step for an 8- or 16-bit image). The CIE, hue and saturation curves always run on the processor. Choose CPU only in to keep Curves on the processor, and see The Processor and the GPU for when the card is used.
6Related Tools
Histogram: shadows, midtones and highlights, and the screen stretch made real.
Saturation: more or less saturation for each hue, along a curve over the hues.
Hyperbolic Stretch: a stretch whose contrast we place where we want it.
SCNR: removes a green or other color cast.