Spectrophotometric Color Calibration
White balance from the spectra of the stars in the field and the curves of our own equipment
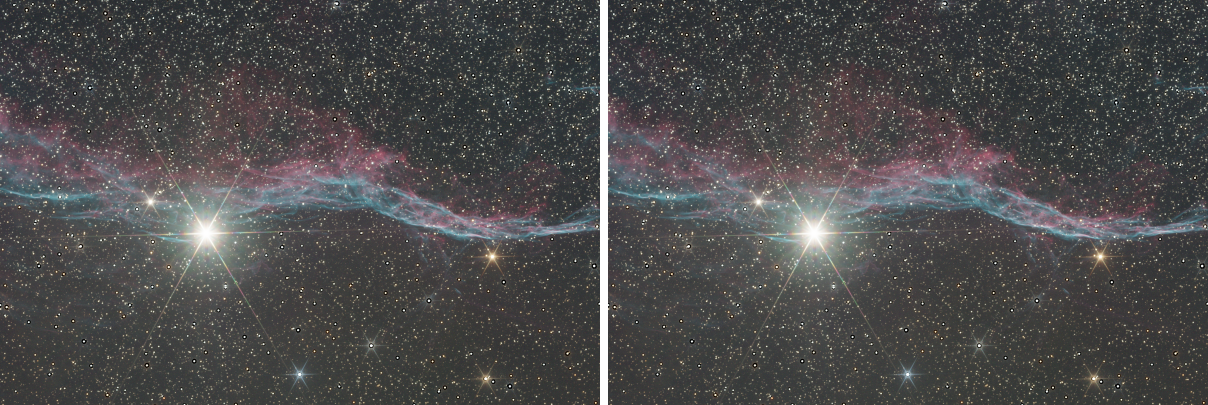
Spectrophotometric Color Calibration balances the colors of an image from the stars in it. It compares what the camera measured for each star of a plate solved image with what the star's own spectrum, from the Gaia catalog, predicts through the filters and the sensor we used, and finds the white balance that makes the stars come out right. It then neutralizes the background. It is the calibration to choose when we know our filters and sensor.
1Introduction
A color calibration needs a white. Color Calibration takes it from a reference, such as a galaxy or the catalog's average star. Spectrophotometric Color Calibration takes it from physics. Every star in the image has a spectrum in the catalog, and we know the transmission of each filter and the quantum efficiency of the sensor. The light the camera should have recorded in each channel is computed by integrating the star's spectrum through the filter and the sensor, and compared with the flux the image shows for that star. Over thousands of stars the ratio of red to green and of blue to green fixes the white balance, and a white reference spectrum, by default an average spiral galaxy, says which color is white.
The image must be plate solved: the stars are matched to the catalog by their positions. The red, green and blue channels are measured on the stars one by one, with a fit of each star's profile, and the white balance is the fit of the measured ratios on the catalog's, with a robust line.
The spectra are those of Gaia DR3 (ESA/Gaia/DPAC), kept in a file of our own beside the catalog files. Without that file the process still runs: each catalog star becomes a black body of the temperature its color gives, through the same curves. The panel and the Log say so.
The curves of filters, sensors and white references are chosen by name from a library that comes with the program and that we can add to. Spectrophotometric Color Calibration follows PixInsight's process of the same name by its parameters, so its icons open here and run. The curves our library does not carry by PixInsight's names are replaced by the nearest of ours, and the Log says so.
2Quick Start
- Open the plate solved color image, linear, and choose . An image that is not solved needs Plate Solve first.
- Choose the camera's curves: the Red filter, Green filter and Blue filter and the Sensor QE, from the lists beside each. For a color sensor, the filter curves are those of the sensor's R, G and B and the Sensor QE is the ideal curve.
- Leave the other settings as they are.
- Click Apply. The Log gives the white balance factors, the number of stars used and the background levels.
3Interface & Parameters
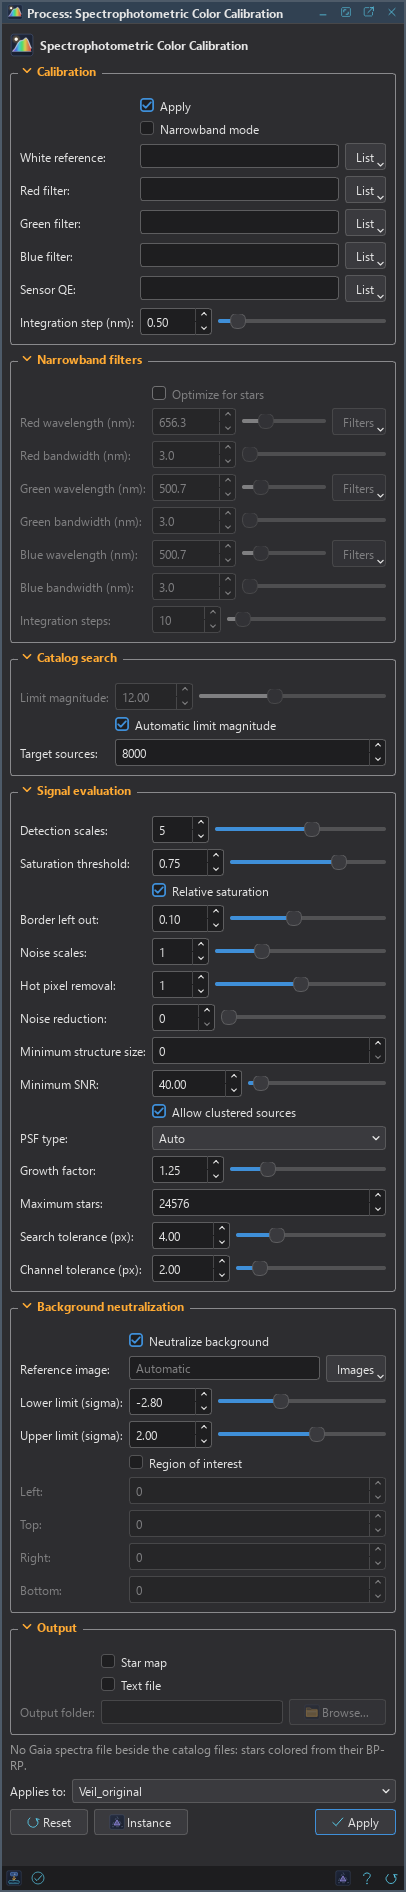
The panel has six sections, Calibration, Narrowband filters, Catalog search, Signal evaluation, Background neutralization and Output, each of which folds away with the arrow beside its title, then the image the process applies to, the buttons and the system bar along the bottom. A line in the panel says when the spectra file is missing and black bodies are used.
3.1Calibration
Apply: Applies the white balance to the image. On by default. Off, the process only measures the white balance: the factors go to the Log and to the image's properties.
Narrowband mode: The channels were taken through narrowband filters: each is given by its wavelength and bandwidth, in Narrowband filters, instead of by a curve. Off by default.
White reference: The spectrum that comes out white. Empty, the default: DSC Average spiral galaxy (5890 K). The list beside it offers the library's white references: the Sun, and the average spiral and elliptical galaxies.
Red filter: The red channel's filter transmission, by name. The default is the red of DSC's color sensor.
Green filter: The green channel's filter transmission. The default is the green of DSC's color sensor.
Blue filter: The blue channel's filter transmission. The default is the blue of DSC's color sensor.
Sensor QE: The sensor's quantum efficiency. Ideal QE curve, the default, is for a color sensor whose filter curves already include it.
Integration step (nm): The step of the integrals of the spectra through the filters, from 0.1 to 5. 0.5 by default.
Each curve has a List beside it with the library: DSPX's own, Filters, Color sensors, Light pollution and duo-band, Mono sensors, White references and My curves, Filter in Front, Import a Curve... and Open My Curves Folder. A filter placed in front of a color sensor is written as the sensor's channel times the filter, such as the sensor's red times a UV/IR cut filter. Import a Curve... reads a table of wavelength and value, in nanometers, Angstroms or micrometers, as a fraction or percent, and keeps it in My curves.
3.2Narrowband Filters
Optimize for stars: Divides each channel's flux by its bandwidth, so that stars of a neutral spectrum come out white. Off by default.
Red wavelength (nm): The red channel's filter: its central wavelength, from 100 to 2500. 656.3 by default.
Red bandwidth (nm): The red channel's filter: its full width, from 0.1 to 1000. 3 by default.
Green wavelength (nm): The green channel's central wavelength. 500.7 by default.
Green bandwidth (nm): The green channel's full width. 3 by default.
Blue wavelength (nm): The blue channel's central wavelength. 500.7 by default.
Blue bandwidth (nm): The blue channel's full width. 3 by default.
Integration steps: The number of steps of the integrals of the spectra over each band, from 5 to 100. 10 by default.
The Filters list beside each wavelength sets it, with its bandwidth, from the narrowband filters of the library.
3.3Catalog Search
Limit magnitude: The faintest Gaia G magnitude searched, from 0 to 30. 12 by default, used when the automatic limit is off.
Automatic limit magnitude: Finds the magnitude that gives about the target number of catalog stars. On by default.
Target sources: The number of catalog stars the automatic limit aims at, from 1000 to 100000. 8000 by default.
3.4Signal Evaluation
Detection scales: The wavelet layers star detection uses: the largest stars detected are about 2 to the power of this many pixels. From 1 to 8, 5 by default.
Saturation threshold: Stars with a pixel at or above this are not measured. From 0.1 to 1, 0.75 by default.
Relative saturation: The threshold is a fraction of the smallest channel maximum, with the border left out. On by default.
Border left out: The fraction of the width and height at each side that relative saturation leaves out, from 0 to 0.25. 0.1 by default.
Noise scales: The first wavelet layers left out of star detection, as noise. From 0 to 4, 1 by default.
Hot pixel removal: The radius of the median filter that star detection applies against hot pixels, from 0 to 2. 1 by default.
Noise reduction: The radius of the Gaussian filter that star detection applies against noise, from 0 to 50. 0, the default, is none.
Minimum structure size: The smallest star detected, in pixels. 0, the default, is automatic.
Minimum SNR: Stars with a lower signal to noise ratio are not measured. From 0 to 1000, 40 by default.
Allow clustered sources: Measures stars that share a structure with others. On by default.
PSF type: The function fitted to each star: Gaussian, Moffat 1.5, Moffat 4, Moffat 6, Moffat 8, Moffat 10 or Auto, the default, the best of Moffat 2.5, 4, 6, 10 and a Gaussian.
Growth factor: The star flux is measured over the fitted PSF times this, from 0.5 to 4. 1.25 by default.
Maximum stars: The brightest stars measured in each channel, at most. 24576 by default.
Search tolerance (px): The largest distance from a star to its catalog position, from 0.1 to 16. 4 by default.
Channel tolerance (px): The largest distance between a star's positions in two channels, from 0.1 to 16. 2 by default.
3.5Background Neutralization
Neutralize background: After the white balance, subtracts each channel's background, so that the sky comes out gray. On by default.
Reference image: Another open image to measure the background on. Empty, the default: the image.
Lower limit (sigma): Background samples below the median plus this many sigmas are left out. −2.8 by default.
Upper limit (sigma): Background samples above the median plus this many sigmas are left out. 2 by default.
Region of interest: Measures the background in the rectangle below only. Off by default.
Left: The left edge of the region, in pixels.
Top: The top edge, in pixels.
Right: The right edge, in pixels.
Bottom: The bottom edge, in pixels.
3.6Output
Star map: Also makes an image marking the stars the calibration used. Off by default.
Text file: Also writes each star's catalog and measured fluxes to SPCC-data.csv. Off by
default.
Output folder: Where the text file goes. Empty, the default: the temporary folder.
3.7Apply and Instance
Applies to: The image the process works on, chosen in a list of the open images. It shows the image in front, and follows it as we bring other images to the front. Picking another image in the list makes the panel work on that one without bringing it to the front, and Follow Active, the small button that appears beside the list, makes the panel follow the image in front again.
Instance: Shows the process as the panel has it now, as text: a DSPX process
(.dsproc) or a PixInsight process icon (.xpsm), chosen under Format. A PixInsight icon carries
every curve's data. Copy puts the text on the clipboard; Save... saves it as a file and puts it on the Process
Shelf.
Reset: Puts every setting back to its default.
The system bar along the bottom has the same commands as small icons: at the left, drag to apply and Apply; at the right, Instance, Help (this page) and Reset. The Apply button changes the image in one history step that Undo takes back, through the image's mask if it has one.
4What the Calibration Does
- Photometry. The stars of each channel are detected and their profiles fitted, and the flux of each is measured from the pixels. Saturated stars are left out. The green channel is the reference; the red and blue stars are matched to it within the channel tolerance, and the catalog stars within the search tolerance.
- Catalog flux. For each matched star, its spectrum is multiplied by the filter and the sensor curves and integrated, in steps of the integration step. For narrowband filters, the integral is taken over each band.
- Fit. The measured red to green and blue to green ratios are fitted on the catalog's with a robust line, the median of the slopes between pairs of stars.
- White balance. The factors that make the white reference neutral are read from the fit, scaled so that the largest is 1, and applied to the pixels.
- Background. With Neutralize background, each channel's median within the two limits is subtracted.
The factors and the background levels are written to the image's properties, and the Log gives them with the number of stars used. In DSPX's own mode stars with a flux excess in the catalog's blue and red photometry are also left out, and the fit is exact up to 25000 stars. With the PixInsight compatibility mode on, in , the fit is the randomized one of PixInsight, and when only black bodies are available the Log says that the result is not PixInsight's.
5Usage Tips and Tricks
Calibrate linear data. The calibration assumes that the pixel values are proportional to the light. Do it before any stretch.
Choose the right equipment. The result is only as good as the curves. A mono camera with an LRGB set needs the filters' curves and the sensor's QE; a color camera needs the R, G and B curves of the sensor and the ideal QE.
Light pollution filters. A dual-band or light pollution filter in front of a color sensor changes the colors that reach it. Choose it with Filter in Front, so the curves are the sensor's channels times the filter.
Check the number of stars. The Log gives the number of stars used. A fit on very few stars is uncertain; raising the limit magnitude brings more catalog stars.
6Related Tools
Spectrophotometric Flux Calibration: calibrates the flux of an image, not its colors.
Color Calibration: a calibration from a white reference of our choice, when the equipment curves are unknown.
Background Neutralization: neutralizes the background alone.
Plate Solve: solves the image, which the calibration needs.