
Statistics
The image's numbers, channel by channel: levels, spread, extremes and noise
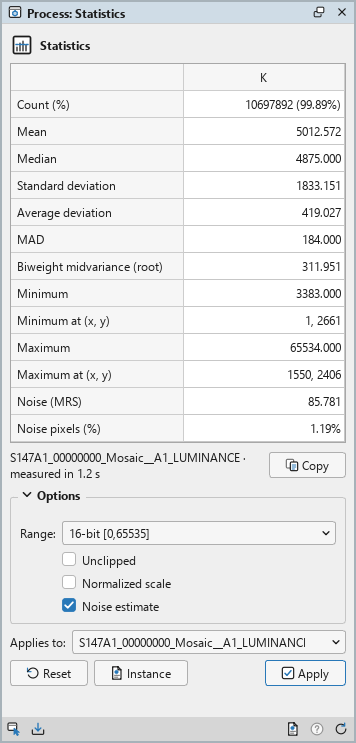
Statistics measures the image, channel by channel: how many samples there are, their mean and median, how widely they spread, the darkest and brightest with where they are, and the noise. Its panel is the table itself, measured again whenever the image changes. We use it to check a frame's background level in the camera's units, to compare the noise of two masters, and to find a clipped or saturated channel.
1Introduction
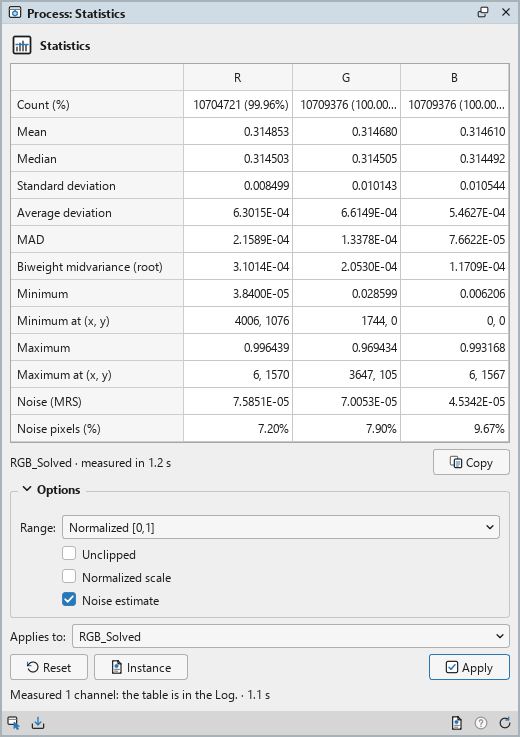
The panel is a table: a row for each statistic, a column for each channel, K for a gray image, R, G and B for a color one. It measures the image the panel applies to as soon as the panel shows, off the main thread on a copy of the pixels, and again whenever that image changes: a process applied, an undo, another image chosen. The image itself is only read.
By default the samples counted are those between 0 and 1, pure black and pure white left out, as PixInsight's Statistics counts them: the black of an image's empty edges and the white of saturated stars do not pull the numbers. The values are shown in the normalized range from 0 to 1, or in a camera's range of 8 to 16 bits, so a raw frame's median reads in the same units as its camera writes.
The noise row is the standard deviation of the noise as image calibration measures it, by the multiresolution
support: the same figure Calibration writes into a frame's NOISE keywords,
which Integration uses to weigh it.
Statistics is our own code, from the definitions PixInsight documents for its Statistics tool. PixInsight's Statistics is an interface, with no process icon, so the panel saves its options as a DSPX process only.
2Quick Start
- Open the image and choose . The table fills in a moment.
- To read the values in the camera's units, set Range to its bit depth, 16 bits for most astronomical cameras.
- To keep the numbers, click Copy and paste them into a spreadsheet, or click Apply to write them to the Log.
3Interface & Parameters
The panel has the table at the top, with a status line and Copy under it, and one section of settings, Options, which folds away with the arrow beside its title. Under it are the image the process applies to, the buttons and the system bar along the bottom. Statistics does not change the image, so it has no live preview.
3.1The Table
Each row has a tooltip that says what it is.
- Count (%): the samples counted, and their share of the channel.
- Mean, Median: the mean of the samples counted, and their middle value.
- Standard deviation: about the mean.
- Average deviation: the mean absolute deviation from the median.
- MAD: the median absolute deviation from the median.
- Biweight midvariance (root): the square root of the biweight midvariance about the median, a robust scale close to the standard deviation without its outliers. Its label takes two lines in the panel, so the numbers keep their width.
- Minimum, Maximum: the extremes counted, and on the rows after each, where it is first found, row by row, in pixels from the top left corner.
- Noise (MRS): the standard deviation of the noise, estimated by the multiresolution support; marked "(k-sigma)" when that estimate did not converge and a k-sigma estimate was used instead.
- Noise pixels (%): the share of the pixels the noise was measured on.
Values are shown with six decimals in the normalized range and three in a range of bits, in scientific notation below 0.001, with the decimal mark of the program's language and region. A row with nothing counted shows a dash.
Copy: Puts the table on the clipboard as it is shown, its cells separated by tabs, for a spreadsheet.
The status line beside Copy names the image measured and how long the measurement took, or says that one is running. When another image is measured, the line under the buttons, from the last Apply, goes. A column is never narrower than its numbers: in a narrow panel the table scrolls.
3.2Options
Range: The units of the values: Normalized [0,1], the default, or a camera's range of 8, 10, 12, 14 or 16 bits, each value times 2n − 1. It changes only how the table is shown: nothing is measured again.
Unclipped: Off by default: only the samples between 0 and 1 are counted, black and white left out. On, every sample is counted. Samples that are not numbers are never counted.
Normalized scale: Off by default. On, the average deviation is multiplied by 1.2533, the MAD by 1.4826 and the biweight midvariance's root by 0.9901, so that each estimates the standard deviation of normally distributed data and the three can be compared with it. Only the table's numbers change.
Noise estimate: On by default: the two noise rows are measured. The noise takes most of the measurement's time; off, a large image is measured much faster.
3.3Apply and Instance
Applies to: The image Statistics measures, chosen in a list of the open images. It shows the image in front, and follows it as we bring other images to the front. Picking another image in the list makes the panel measure that one without bringing it to the front; the pick stays while we work on other images, and Follow Active, the small button that appears beside the list, makes the panel follow the image in front again. An image that a tool or a run is working on is listed, but cannot be picked.
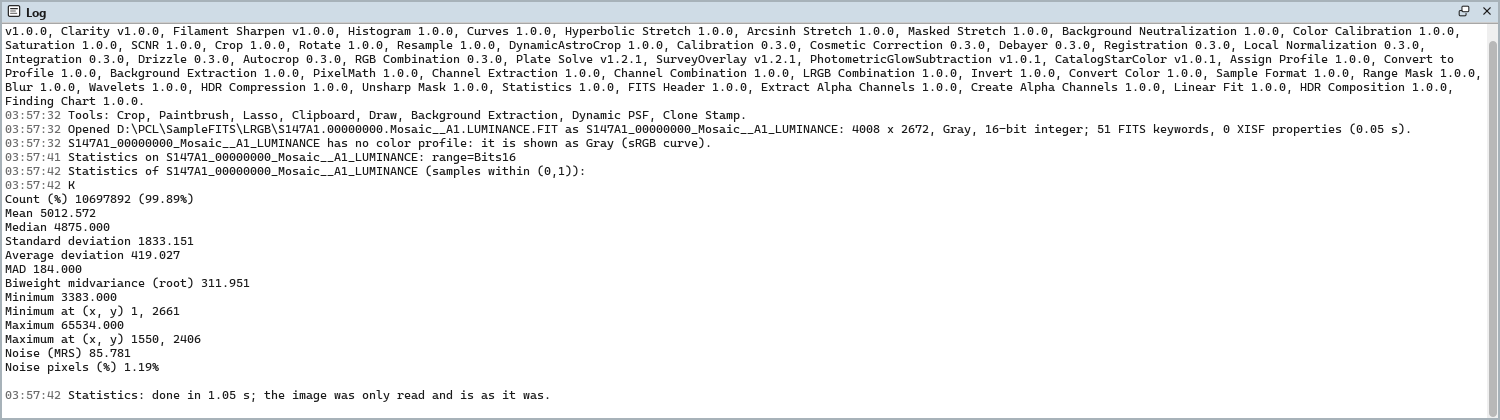
Apply: Measures the image named in Applies to and writes the table to the Log, in English, as the Log is. Nothing in the image changes and no history step is recorded, so a process container or a workflow can put an image's statistics in the Log along the way.
Instance: Shows the process as the panel has it now, as text: its options as a DSPX
process (.dsproc). PixInsight's Statistics has no process icon, so there is none to write. Copy puts
the text on the clipboard; Save... saves it as a file and puts it on the Process Shelf.
Reset: Puts every option back to its default.
The system bar along the bottom of the panel has the same commands as small icons: at the left, drag to apply and Apply; at the right, Instance, Help (this page) and Reset. Drag to apply, the first icon, carries the process with its options: dropped on an image's window, it writes that image's statistics to the Log; dropped on the Process Shelf, it is kept there as a row of its own. With , the bar alone has them.
4What Is Counted and How the Noise Is Measured
The statistics are computed in double precision from the samples counted, whatever the image's sample format: the mean and the standard deviation (about the mean, with n − 1) from compensated sums, the median as the middle value, or the mean of the two central values of an even count. The biweight midvariance is Wilcox's, about the median, with a limit of 9 MADs. Alpha channels are not measured.
The noise is measured on the whole channel, whatever Unclipped says, by the multiresolution support: the image is
decomposed into wavelet layers with the B3 spline, as PixInsight does, and the standard deviation of the noise is
estimated from the first four layers, then three or two when that does not converge, else by a k-sigma estimate. On a
frame PixInsight calibrated, it gives PixInsight's own NOISE00.
5Usage Tips and Tricks
The camera's units. Set Range to 16 bits to read a raw frame as the camera wrote it: a bias level, the background of a light frame, how near the stars come to saturation.
Compare noise. To compare two masters, or a master before and after noise reduction, read their Noise (MRS) rows: it is the figure Integration weighs frames by. Leave Noise estimate off when only the levels matter: the table is much faster.
Clipped or saturated. A Count well below 100% means many samples are black or white: an image cropped with black edges, a stretch that clipped the shadows, or saturated stars. Unclipped on shows how many.
Robust figures. The median and the MAD are not moved by stars and hot pixels; the mean and the standard deviation are. With Normalized scale on, the MAD and the biweight are comparable with the noise of the background.
6Related Tools
Histogram: the distribution of the values, and a stretch of them.
FITS Header: the keywords where Calibration and Integration keep a frame's noise estimates.
Dynamic PSF: the size and shape of the stars.
Pixel Math: an image's mean, median, deviations and extremes inside an expression.