Clouds of Andromeda
“Ionized gas in the Milky Way is ubiquitous, with a pervasive
yet faint background detectable in nearly every direction in the northern sky.”
~ The Wisconsin H-Alpha Mapper Northern Sky Survey, Haffner et al.
Clouds of Andromeda
Clouds of Andromeda II
WHAT IS ''CLOUDS OF ANDROMEDA''?
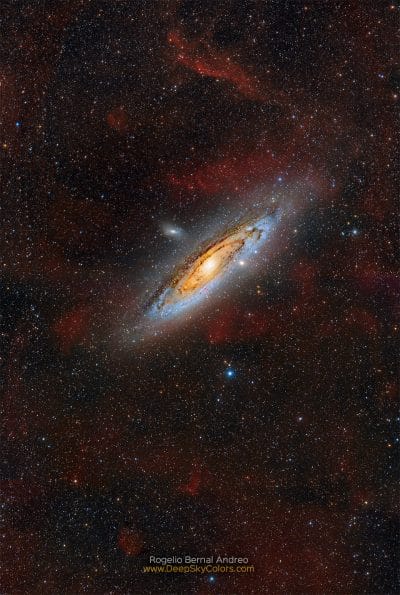
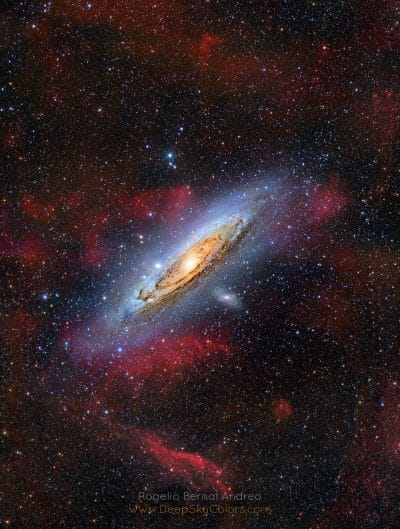
Clouds of Andromeda is a rather unique – yet 100% based on real data- view of the Andromeda galaxy, also known as M31. It is, to my knowledge, the first known image of M31 that also shows at high resolution, depth and full color several of the cloud formations from our own Milky Way that happen to be in this very same field of view – but much closer to us than M31.
If you’re familiar with views of Andromeda, the clearly visible reddish nebula in the image might surprise you. Being one of the most photographed objects in the night sky, if not the most, you might even be skeptical at first. How could everyone miss it and all of a sudden it’s here, clear and obvious? Well, we all did… until now. Or at least, most of us did! If you came here out of curiosity or looking for answers, be reassured that the data is real and the clouds really are there. Just keep reading.
UPDATE 6/2018: Clouds of Andromeda II is a newer version of the image, with more data added, specifically from an image of Andromeda I captured in 2014 and a new processed layer of the same H-Alpha signal used to create “COA I”. The image was released on June 28, 2018.
HOW THIS GOT STARTED?
On September 9, 2016, Sean Walker from “Sky & Telescope” shared with me a heavily stretched image he had captured – 1 hour total exposure – of the area surrounding the Andromeda Galaxy in the very narrow Hα spectral band, where he had noticed some extremely faint but visible structures. I had been capturing this area with broadband filters in the past, and I knew there’s certainly some very faint dusty structures detectable in visible light around the vicinity of M31’s field of view that Sean also used to compare his own findings. I had no idea however that there would also be such well-defined clouds glowing in Hα, though. Sean’s own curiosity is what really sparked the flame to get this image, and for that I thank him, and please, do thank him too if you run into him online or anywhere else.
If you’re familiar with my work, you know I’ve always been attracted to capturing the dust high galactic cirrus clouds that are so faint they rarely appear in most astroimages. I talk about this extensively in my book Deep Sky Colors, by the way. It is no surprise then, that I was incredibly interested in these faint clouds Sean just noticed.
THE DATA
After accumulating several hours of Hα exposure over the area per pane (the image is a cropped three panes mosaic: A:15h, B:15h, C:7.25h), I was able to bring out – in some cases nearly from the noise floor – a number of extremely well defined structures accompanied by even fainter clouds. I then captured a few hours of LRGB – nothing deep – that I merged with existing broadband data I already had, and then I combined both, the Hα and LRGB data the best way I could, bringing out as much as the Hα signal as possible while trying not to introduce artifacts or false data and of course, while keeping the noise to a minimum.
WHAT ARE THESE CLOUDS? WHAT ARE THEY MADE OF?
There’s mainly two types of clouds/nebulae in our Universe: emission and reflection nebula (there’s other types, just trying to keep it simple!). Emission clouds emit light on their own and are usually made of ionized gas. The most popular and abundant type of gas clouds are made of Hydrogen, glowing bright in the H-Alpha wavelengths (deep in the red), so astrophotographers often use an Hα filter to capture them. Reflection nebula, on the contrary, is usually made of dust that doesn’t produce any light, but we can see it because it reflects light from nearby stars and it usually shines nicely in visible light.
Along with all the bright emission and reflection nebula we usually see in photographs, our night sky is filled with a much fainter type of clouds that goes by different names: High Galactic Cirrus, Integrated Flux Nebula (IFN), Translucent Clouds, High Latitude Clouds and so on… (Low et al., 1984)
IFN is usually visible in infrared, and can also be – barely – captured under dark skies in “visible light” because it’s mostly dust (not gas) that manages to reflect the light of our own galaxy as a whole. It, however, can also emit some light in the Extended Red Emission or ERE (Witt et al. 2008), a wide spectral range that covers all red visible light all the way to the near infrared. This is one reason IFN usually appears brownish in color when captured with broadband filters: it’s a mix of reflected blue light and some emitted ERE (red) light.
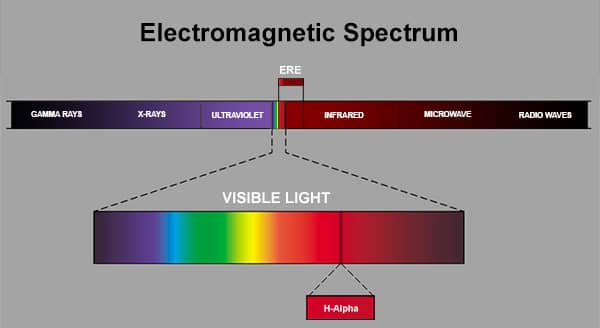
This, however, means that capturing dust cirrus with an Hα filter, which, unlike visible light, ERE or infrared, covers a minuscule spectral range (see image below) where ionized Hydrogen (a gas) glows, makes absolutely no sense. Or… does it?
The following chart illustrates the classification of the electromagnetic spectrum as we know it, also indicating the different spectral ranges we’re discussing: H-Alpha, visible light, infrared and ERE.
About 99% of the times, if not 100%, astrophotographers like myself use Hα filters with the sole purpose of capturing the many clouds of ionizing gas shinning strong at this band pass that abound in our night sky, and it’s amazing the amount of signal we get. Likewise, some of us try our luck capturing the IFN by shooting with broadband filters (visible light).
In this case, however, what I captured by using an Hα filter is cirrus dust that happens to glow at precisely this very narrow spectral range – that’s the consensus from the professional astronomers I’ve contacted prior to releasing this image. Of course, the conundrum here is that we’re talking about dust that glows because of ionizing gas, but I’ll leave it at that. If you want to learn more about this topic, there’s plenty of information out there – look for scholar papers, thesis, scientific journals and the like.
As a long time astrophotographer chasing the faint galactic dust that can be detected – but rarely seen – in nearly every direction in the sky, being able to reveal just self-glowing “IFN” for the first time in an outreach-type image is short of amazing. Being accurate, these clouds aren’t quite Integrated Flux Nebula or IFN, as the name IFN derives from dust reflecting light from our whole galaxy, while these clouds of dust fluoresce in the deep red instead, so they’re more like Dust Fluorescent Nebula or DFN 🙂 (I just made that up, not an official name!).
PROCESSING CRITERIA
The relative brightness between M31 and the faint clouds in “Clouds of Andromeda” is not depicted in the image. The galaxy is actually much, MUCH brighter than the glowing clouds! Please, see below the half-cooked negative of one of the panes, where a more relative brightness can be seen, with M31 completely saturated in order to get a glimpse at some of these clouds.
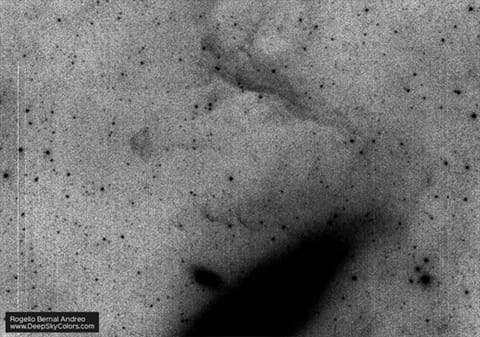
That said, the relative brightness of the glowing clouds has been preserved as much as possible in the final image, so clouds that appear brighter than others, really are brighter.
Integrating Hα and LRGB data was not done via a copy/paste/crop composite or a typical HDR. Instead, I registered both sets (broadband and narrowband data), then went onto process them and integrate them, bringing out the signal from the extremely faint clouds while containing the brightness of M31. Processing was done with PixInsight for all of the initial work on each data set, then all integrated via several layers in Photoshop, where I applied further enhancements and final adjustments. My goal was to produce a nice representation of the best of what both data sets could offer, and present the image in a typical “true-color” LRGB+Hα composition.
CONFIDENCE
I am 100% confident on the results, at least the 5-7 brightest structures – identified in the image below. These are no artifacts. AN-6 would be the only labeled structure for which I’m still not 100% certain, not because my data was doubtful but because of no match with existing survey data (see the “Comparison” section below). As for the faintest yet reddish smudges across the image, being pulled nearly from the noise floor, I would still assign them some level of confidence, although not as much as the obvious brightest structures.
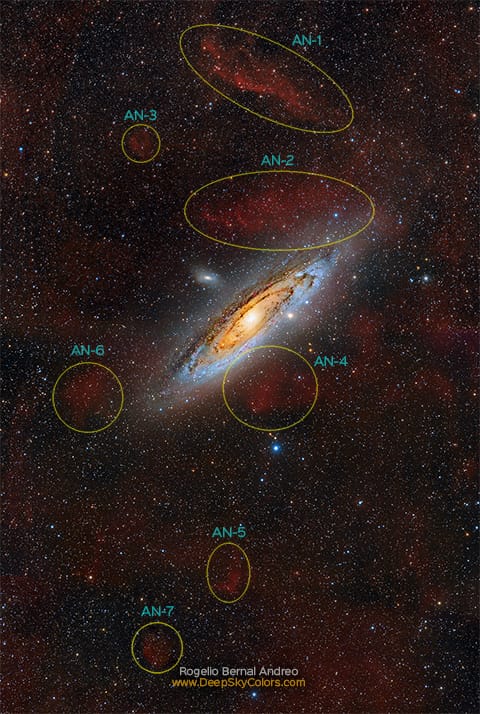
The lowest area of confidence would be the entire area being covered by M31 and its very immediate halo – still brighter than the sky background. In other words, the pitch-black area over the glowing M31 in the negative image above. The galaxy is so bright that any signal from any faint clouds in front of it simply can’t be detected. This results in no visibility of clouds right over M31 or its immediate halo. That’s the reason you don’t see red clouds right in front of M31, perhaps giving the impression that the clouds are behind the galaxy, when they’re not.
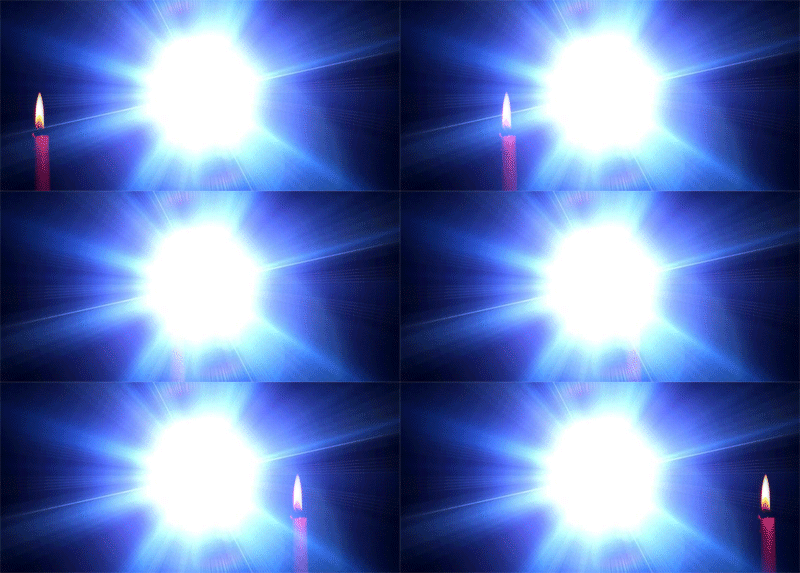
If the above wasn’t too clear, the animation below hopefully helps. The candle is assumed to be in front of the bright light, not behind. We can see the candle light only as long as it’s NOT right in front of the bright light. When it is, the fainter candle light is simply overwhelmed by the bright light behind, so we can’t tell there’s a candle light in front. In this case, the bright light is Andromeda and the candle light represents our very faint red clouds. Since we can’t detect these faint clouds right in front of M31, it makes sense you don’t see any in the image, and see M31 instead.
COMPARISON
Although my data seemed reliable, once the final image was completed, I compared it to existing surveys, to see whether there was a match or not.
Some people will find interesting to know that infrared sky surveys revealed no spatial correlation with my image nor with Hα surveys, neither did microwave surveys, meaning these clouds are invisible at infrared – odd for high galactic cirrus clouds – and microwave wavelengths.
Visible light surveys simply don’t show any clouds whatsoever, which isn’t surprising, as these clouds are extremely faint. The two Hα surveys I checked (WHAM and VTSS), however confirmed the structures are there. It makes sense, as that’s the wavelength I used to capture them. Here’s an animation blinking between my image and the VTSS survey, confirming the presence of the 5-7 brightest structures in my image. A mismatch in the fainter areas does not mean my representation is necessarily wrong, but a lower degree of confidence in those areas.
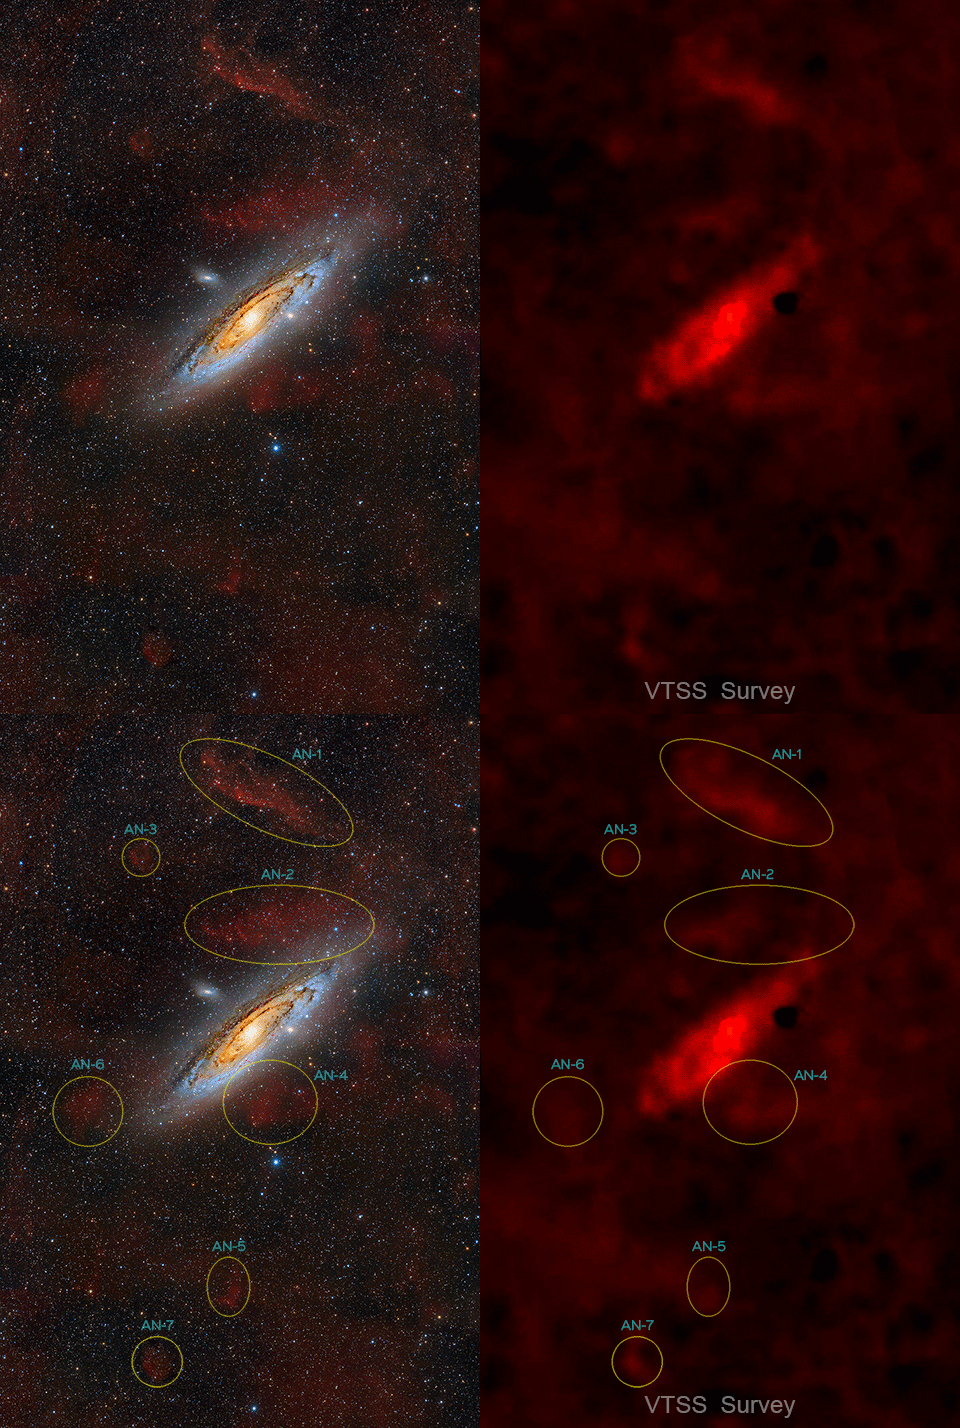
Please note that the survey image has been aggressively softened to remove noise, and globally adjusted to offer better contrast.
ACQUISITION
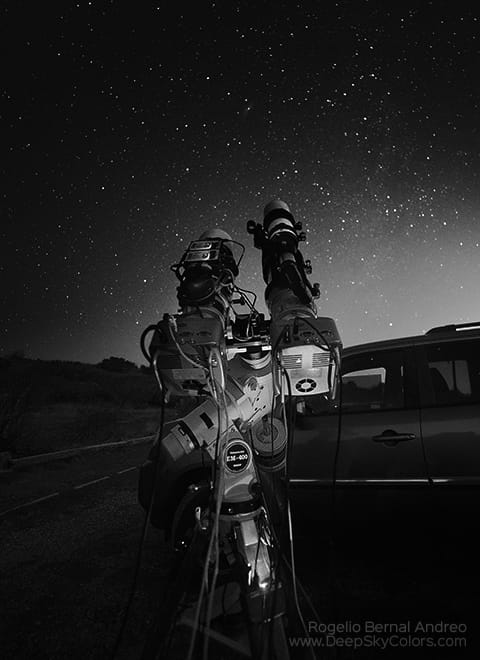
To capture the data I used two Takahashi FSQ106-EDX refractor telescopes (4″ telescopes) and two SBIG STL11000 CCD cameras, in tandem, all on top of my trusted Takahashi EM-400 mount. Being a nomadic imager (I don’t have an observatory of my own), I actually captured the data from three different locations: DARC, Henry Coe State Park and Montebello OSP, all in California. Data was acquired between October and December, 2016. Here’s a black and white picture of my rig during my last session for this project in Montebello on December 21, 2016, in company of some good old astro-friends (who got the premier right that night! 😉 and pointing, of course, at M31.
DISCOVERY?
As the above blinking sequence comparing both Hα surveys indicate, the presence of clouds emitting light in the Hα wavelength around the field of view of M31 is not unknown. I could not however find any “decent” image (resolution and/or depth) of these clouds, other than very low resolution public data from the sky surveys I’ve mentioned, that didn’t say much about these clouds other than they’re there. Discovery? I don’t know and it’s not something I’m after. Besides, Sean Walker would definitely deserve the credit, since he’s the one who noticed and brought it to my attention. That said, there is something definitely special about this image, discovery or not.
The Andromeda galaxy is the most photographed object in our night sky, along with Orion’s Nebula and the Pleiades – and one of the oldest ever been photographed as well. There’s literally thousands of images of M31, and many more being taken every year, from professional observatories to some hobbyist attaching a camera to a telescope for the first time. It is also the most studied galaxy (other than our own Milky Way), being so close to us and providing us with the largest view of a whole galaxy that we have. The fact I was able to produce such unexpectedly gorgeous view of M31 “surrounded” by real clouds based on actual data, in a first-of-its-kind photograph is both, humbling and tremendously exciting.
Clear skies!
Rogelio Bernal Andreo
ACKNOWLEDGEMENTS
- The blinking VTSS Survey image was obtained from Sky-Map.org, based on the Finkbeiner H-Alpha All-Sky map which, for this region is based on the Virginia Tech Spectral-Line Survey (VTSS), which is supported by the National Science Foundation.

