
DeepParallax Studio – Real star depth explained

What “Real Star Depth” Actually Means
How DeepParallax Studio turns measured stellar distances into the depth you see, what is data, what is scaled, and what is honest craft.
When you watch a DeepParallax Studio flyby, the stars drift past each other: near ones sweep by, far ones barely move, and the nebula hangs among them at its own distance. We call this “real star depth”, and it is a claim worth explaining properly, because part of it is measurement, part of it is scaling, and part of it is informed judgement. This article says plainly which is which.
Where the distances come from
Between 2014 and 2025, the European Space Agency’s Gaia spacecraft measured the positions of nearly two billion stars with extraordinary precision, watching each one shift against the background as the Earth (and Gaia with it) orbits the Sun. That tiny annual shift is called parallax, and it is the most direct distance measurement astronomy has: the closer a star, the larger its parallax. It is the same effect as holding a finger in front of your face and blinking one eye and then the other, only performed across a baseline of 300 million kilometers and measured in milliarcseconds: a coin seen from four thousand kilometers away covers about one milliarcsecond of sky. Gaia measures shifts that small routinely.
From a star’s parallax follows its distance. This is not a model or an inference from brightness; it is trigonometry applied to a measured angle, the same method surveyors have used on Earth for centuries.
DeepParallax Studio carries a catalogue derived from Gaia DR3, plus the Hipparcos catalogue for the brightest stars (Gaia’s detectors saturate on very bright stars, so the older mission fills that gap). When you load an image, this happens:
First the image is plate solved: the program identifies the star patterns and works out exactly which piece of sky the image shows, and how it is rotated and scaled. From that moment, every pixel has a sky coordinate.
Then every star the program detects in your image is cross-matched against the catalogue: this dot of light at this sky position corresponds to this Gaia star, with this measured parallax, and therefore this distance. A typical deep-sky image yields hundreds to thousands of such matches.
None of this is hidden. The Detected Stars window lists every star the program found, one row each: which catalogue it matched (Gaia, Hipparcos, or no match), its sky coordinates, its measured parallax in milliarcseconds, its magnitude, its distance in parsecs, and the depth it was assigned in the scene. You can sort the table, filter it, and export it to CSV and check any star against public astronomy databases yourself.
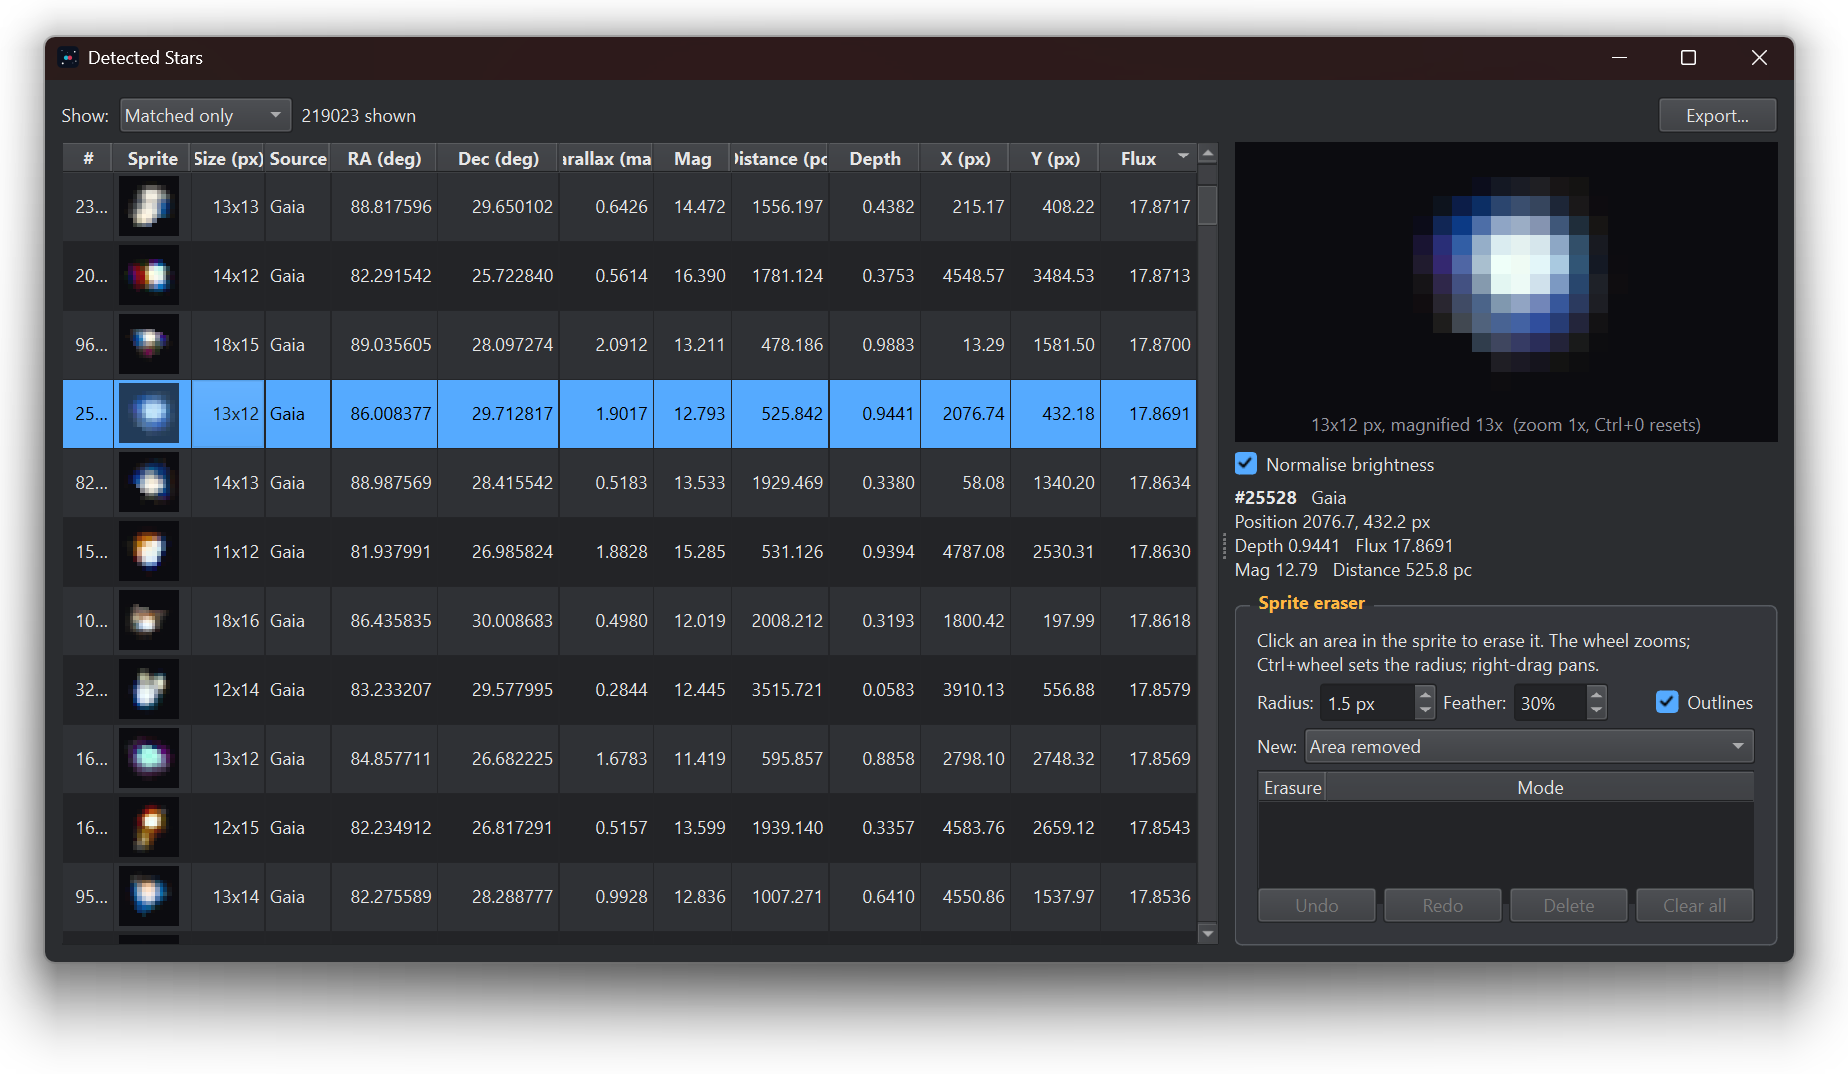
The Detected Stars window, showing the table with Source, Parallax, Distance and Depth columns, and the sprite detail pane
How thousands of light-years fit into a small parallax effect
This is the most common question, and the answer starts with an uncomfortable fact: the true parallax of deep-sky objects is invisible. If you could teleport from one side of the Earth’s orbit to the other, a star a thousand light-years away would appear to shift by about three milliarcseconds: roughly a thousand times finer than the sharpest detail in an excellent amateur image. Rendered truthfully, a flyby would show nothing move at all. That invisibility is precisely why it took until 1838 for anyone to measure a stellar parallax, and why it takes a space observatory to do it well.
So DeepParallax Studio does what every planetarium, orrery and museum model of the solar system has always done: it builds a scale model. The measured distances are compressed into the scene’s depth range, and the virtual camera’s movement is scaled up until the geometry becomes visible. What is preserved is what matters perceptually and scientifically:
The ordering is real. A star that is nearer than another in the data is nearer in the scene, always.
The grouping is real. Stars of a cluster sitting at 1,300 light-years stay together as a slab, separated from the foreground stars at 400 and the background at 5,000. When the camera moves, they move as the group they physically are.
The magnitude of the motion is scaled. The parallax you see corresponds to a camera baseline of light-weeks or more, not centimetres. This is a deliberate exaggeration, it is adjustable, and it is the only honest way to make real geometry perceivable: the alternative is a still image.
So when someone asks “is that really what it would look like?”, the accurate answer is: it is what the real arrangement looks like from an impossible vantage, a camera free to move distances no spacecraft ever will. The arrangement is measured; the journey is the model.
How reliable is it?
As reliable as its sources, which are the best that exist today, with caveats the program does not hide.
Gaia DR3 parallaxes for well-measured stars are precise to a few percent within a few thousand light-years, degrading with distance and faintness, as all measurements do. A star at 400 light-years is placed with excellent confidence; one at 8,000 light-years carries a proportionally larger uncertainty, though its ordering relative to genuinely near and far stars remains solid.
Not every detected star gets a match. Very faint stars, blended pairs, and artifacts fall below the catalogue’s reach or fail the match. The Detected Stars window marks these honestly as unmatched, and you choose what happens to them: they can be placed by a statistical model, or omitted from the depth effect entirely. An unmatched star is never silently passed off as a measured one.
There is also the opposite case: two or more stars so close together that their light merges into a single shape can be identified as one star, and then share one depth. In a field of hundreds of thousands of detected stars, these amount to a negligible sliver of the population, and the program works to keep it that way: groups of neighbouring stars that can be separated cleanly are split apart automatically, each recovering its own distance and its own motion. For the rare pair that cannot be, and is prominent enough to matter in a composition, DeepParallax Studio provides the tools to reshape or correct it by hand.
The Star Distance Distribution window makes the whole census visible at once: a histogram of every matched star’s distance in the image. You see the foreground population, the cluster or association the image is really about, and the far background, each as a bump in the distribution. It is the single best reality check in the program: if the histogram looks wrong for the field, something upstream (usually the plate solve) deserves a second look.
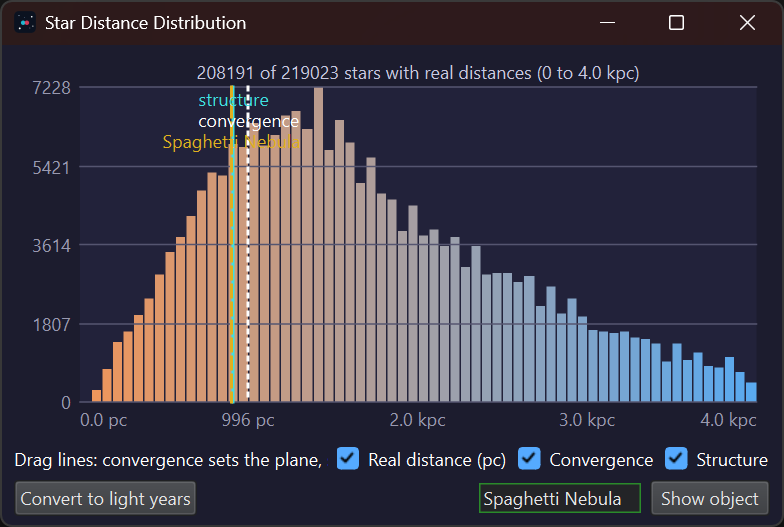
The Star Distance Distribution window, with the distance histogram, the gold reference line at a recognized object’s distance, and the blue structure line]
The nebula question
Sharp readers will notice everything above concerns stars. What about the nebula itself, the cloud that fills the frame? Here is the honest situation, and it applies to every piece of software on Earth, not just this one.
No measured 3D map of any nebula exists, with a near-exception worth citing: researchers have reconstructed approximate three-dimensional shapes for two molecular clouds, Orion A and the California Nebula (Rezaei Kh. and Kainulainen, The Astrophysical Journal Letters, 930, 2022), using the dimming of stars behind and within the dust. These reconstructions are scientifically valuable and far too coarse to drive imagery, and they cover exactly two objects. For everything else, astronomy can tell you how far away a nebula is as a whole, usually from the stars born inside it, and nothing about its internal shape along the line of sight.
So any program that renders a nebula in 3D is making its internal shape up. The difference is in how the making-up is anchored, and how openly it is done.
DeepParallax Studio anchors it in data at every point where data exists:
The distance is real. Name the object, and the program looks up its catalogued distance and draws it as a gold line on the Star Distance Distribution histogram. You then place the nebula’s median depth, the blue line, right on it. The cloud now sits among exactly the stars it belongs with: the ones born from it in front of and behind it, the unrelated foreground sprinkled before it, the deep background far beyond. This single step is most of what makes a flyby feel physically right, and it is pure measurement.
The thickness is a stated choice. Around that anchored distance, you decide how deep the structure extends. The program shows you the resulting depth distribution as you work, so the choice is deliberate, visible and revisable, never a hidden default.
The internal relief is informed craft. Within the cloud, depth is sculpted using visual cues that reflect how nebulae actually present themselves: dark dust lanes silhouetted against emission must be in front of what they obscure; a bright rim lit by a star cluster faces its illuminator; denser knots stand apart from diffuse veils. The Depth Modelling editor lets the artist shape the map by hand with those constraints in view. This is the same class of judgement a scientific illustrator or a planetarium show director exercises, applied with better tools and anchored, at the object’s scale, to measured distances.
Could a real nebula surprise us if we could fly there? Certainly. Until someone produces a measured 3D map to be wrong against, anchored visual plausibility is the state of the art, and we would rather say so than pretend otherwise. Give us a real, well-defined 3D map of a nebula and the program will honour it; none exists.
What is real, what is scaled, what is crafted
A summary you can hold us to:
Measured: the distance of every star matched to Gaia or Hipparcos; the identity and distance of the named object; the sky geometry of the image via the plate solve. All of it inspectable, star by star, in the Detected Stars and Star Distance Distribution windows.
Scaled: the strength of the parallax motion. Real geometry, model baseline, adjustable by you; rendered at truth it would be a still image.
Modelled: the placement of unmatched stars, if you choose to keep them, and the nebula’s internal relief, anchored at its measured distance and sculpted for visual plausibility because no measured alternative exists anywhere.
“Real star depth” means exactly this: where measurement exists, it is used, it drives what you see, and you can audit it. Where it does not exist, the gap is bridged openly, anchored to the nearest measured fact, and never dressed up as data. We think that is the strongest claim anyone can honestly make with what astronomy has measured so far, and the program is built so you never have to take our word for it.